Data Preview
The data preview tab provides an overview of the recent data for the signal chosen. The type of preview is provided based on the format of the data. The currently supported data formats are:
1D time series data
The 1D time series preview is a 2D chart that displays the data against the time. The preview shows the recently recorded data.
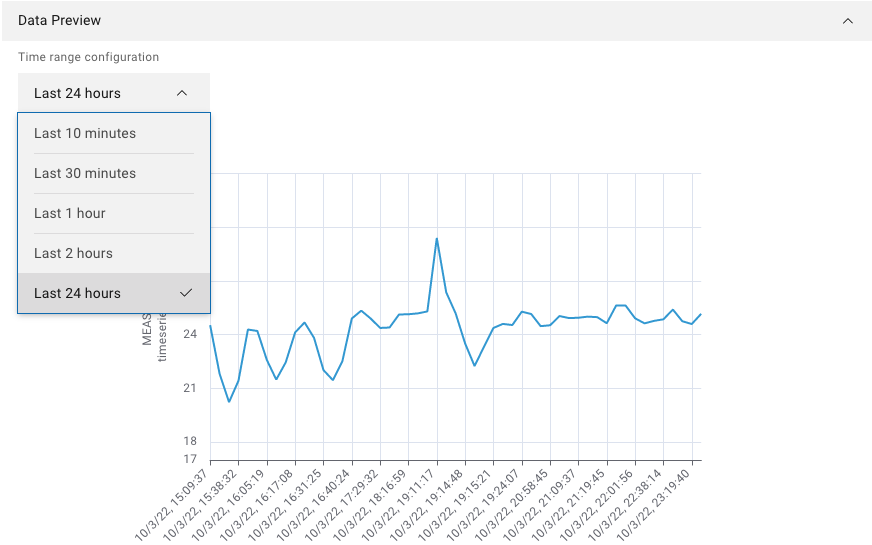
Figure 21 Example of 1D time series data preview
1D product based data
The product-based signals are data mapped against the length of a product produced with the help of genealogy. The preview provides a 2D chart for the signal of the recently produced products. With the help of the dropdown menu, the user can choose to preview the last 1, 2, 5, or 10 produced products. By clicking on the legend at the bottom of the axes, the user can choose between the product to display or to hide.
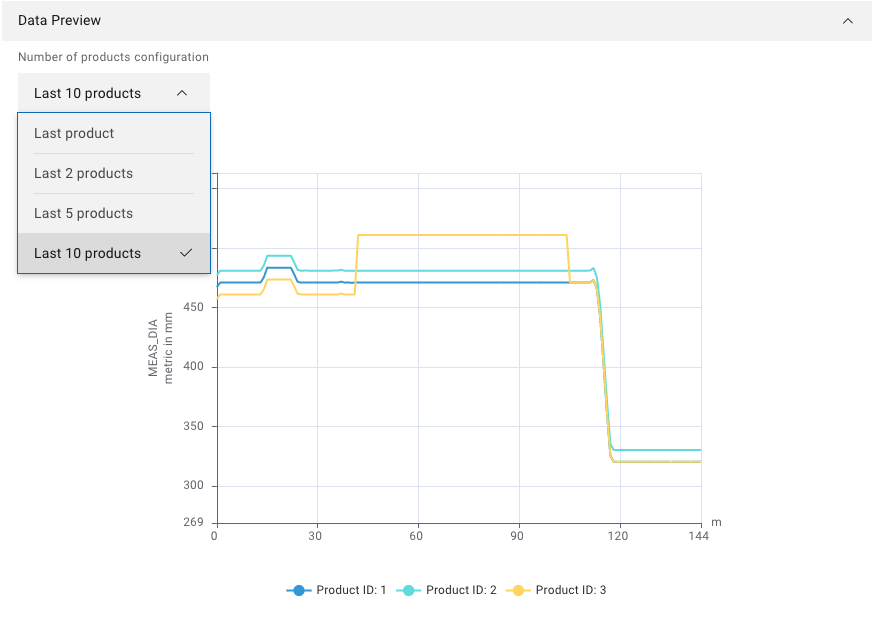
Figure 22 Example of 1D product based data preview
Scalar data
Represents individual values which are displayed in the form of a table. With the help of the dropdown menu, the user can choose between the last 10, 25, or 100 records to display.
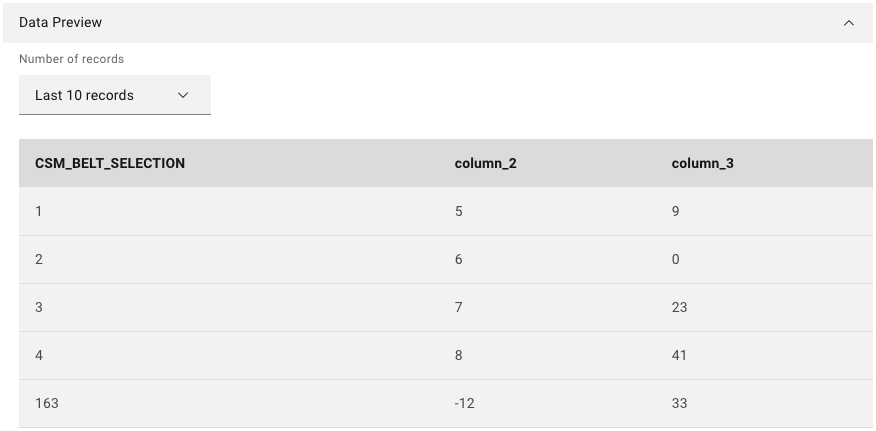
Figure 23 Example of scalar data preview
2D Data
The 2D data is presented in the form of a heat map. With the help of the dropdown menu, the user can choose between the last five produced products to display.
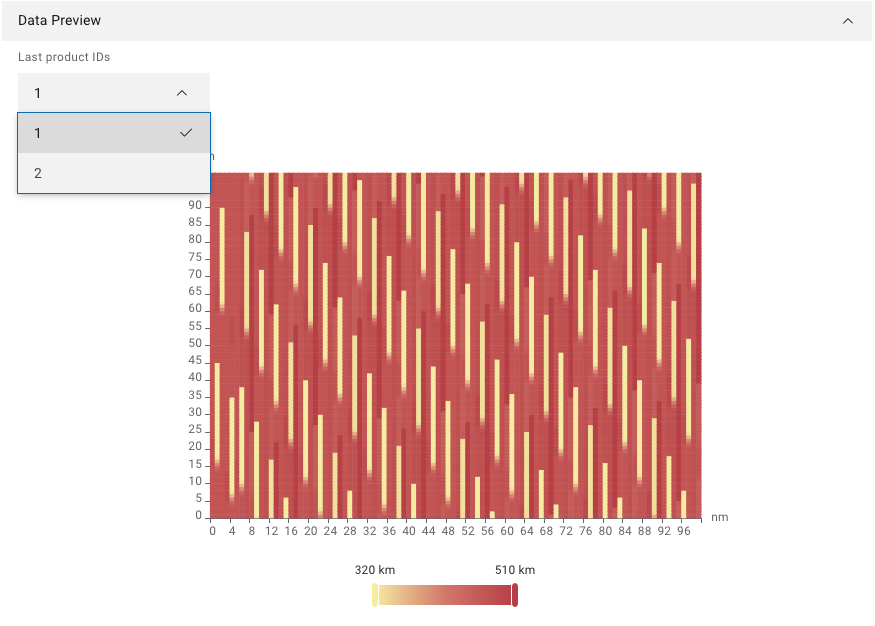
Figure 24 Example of 3D product based data preview
Blob
The Blob are provided as a downloadable file to preview. The user is provided with the latest produced blob file.