Metadata Statistics
The metadata statistics give the user an overview of the status of the metadata.
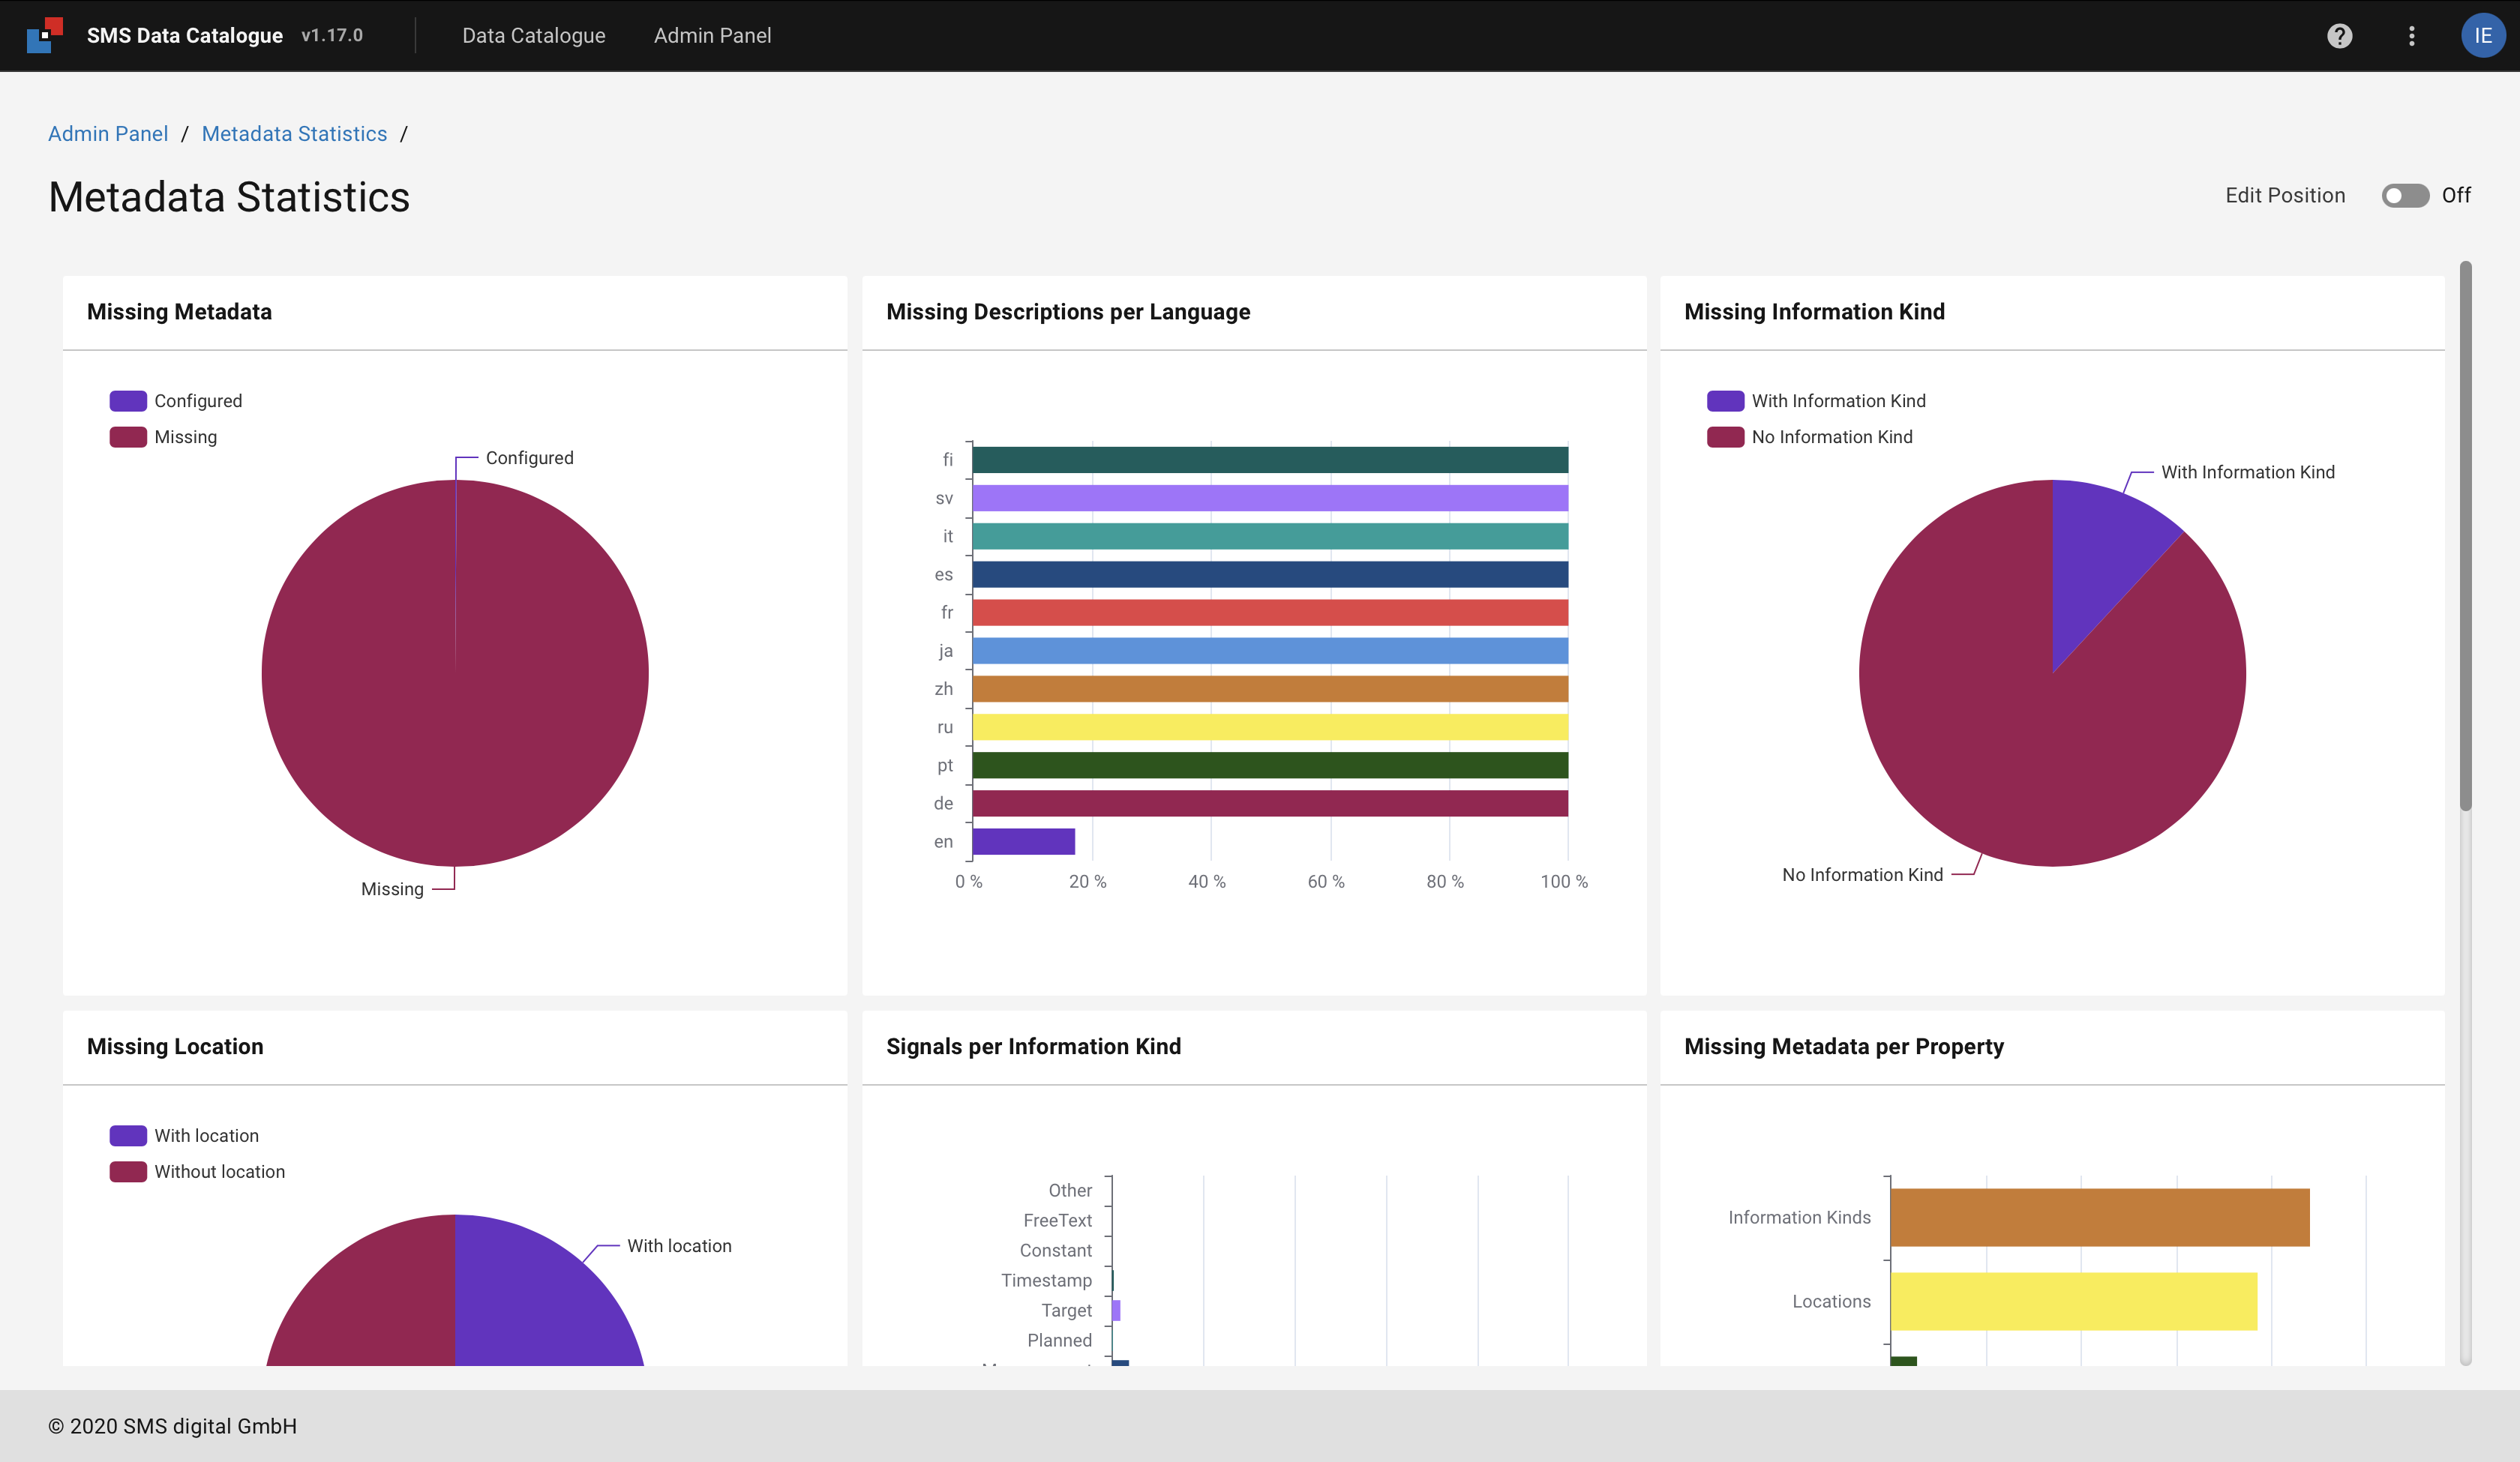
Figure 51 The metadata statistics overview.
The overview provides the user with several charts containing information about the metadata.
By turning the Edit Position button on, the user is able to rearrange the charts.
The changes are stored for the user in the browser cash and can be reset by deleting them.
The charts give the user the percentage of the information missing in the metadata, such as description, location, units, etc.
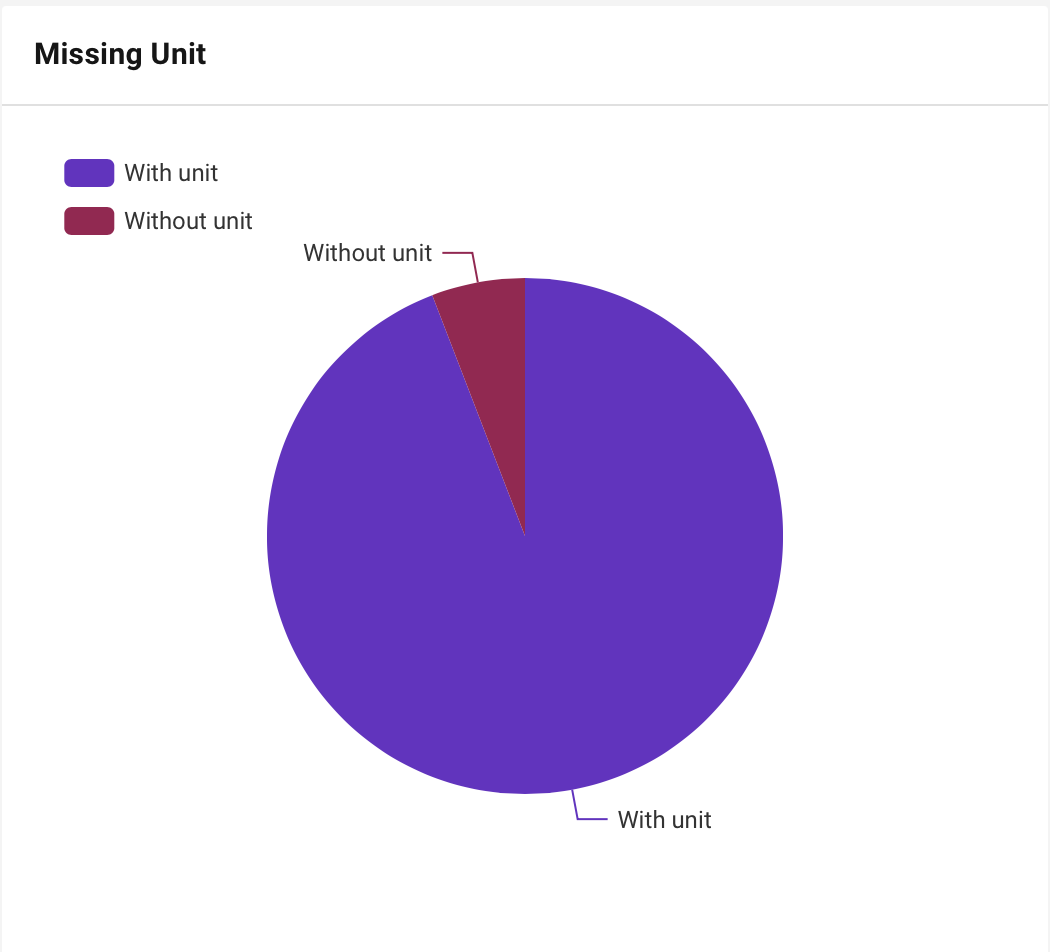
Figure 52 Pie chart displaying the propotion of signals with missing units.
By clicking on the chart, a new tab opens containing the signal filtered to the selected part of the chart. Editing and resetting the filter is achieved in the Advanced filter menu.